
CaliforniaWell Data
Every dot on this map is a real well. We pulled all 1,051,746 California well-construction records - depth, water level, yield, and county - and drew the state with them. Brighter means more wells; color is how deep they go.

165 ft
Median recorded depth
53 ft
Median water level
26 gpm
Median yield
58
Counties covered
Check the water table at your California address
See typical well depth and static water level near any California address, drawn from these same records - free.
What 1,051,746 California wells tell us
1,051,746
California well records on file
165 ft
Median recorded depth, all boreholes (half between 64 and 308 ft)
53 ft
Median static water level (water table)
26 gpm
Median tested well yield
71%
Have a recorded depth (748,656 wells)
3,173
Distinct drilling companies on record
The median depth across all California borehole records is 165 ft, with half falling between 64 and 308 ft. These cover every borehole filed with the state - water wells alongside monitoring wells, soil borings and decommissioning reports - so this is a broader population than water wells alone. Numbers here come straight from filed construction reports - not a model.
How deep California wells go
Each bar is the share of records finished at that depth (20-ft bins). Half of all California records fall between 64 and 308 ft.
Well depth & water by California county
All 58 California counties, ranked by number of records on file. Median depth, median static water level, and median tested yield for each - real figures, computed from every filed report we hold.
| County | Wells | Median depth | Water level | Yield |
|---|---|---|---|---|
| Santa Clara | 80,857 | 39 ft | 24 ft | 26 gpm |
| Los Angeles | 69,476 | 86 ft | 53 ft | 19 gpm |
| Fresno | 52,411 | 204 ft | 73 ft | 51 gpm |
| Sonoma | 49,613 | 158 ft | 37 ft | 27 gpm |
| Riverside | 37,400 | 264 ft | 78 ft | 22 gpm |
| Alameda | 36,716 | 30 ft | 15 ft | 22 gpm |
| San Diego | 36,543 | 204 ft | 47 ft | 25 gpm |
| Sacramento | 35,354 | 120 ft | 48 ft | 64 gpm |
| Tulare | 33,527 | 243 ft | 70 ft | 101 gpm |
| San Bernardino | 31,788 | 227 ft | 102 ft | 25 gpm |
| San Joaquin | 30,007 | 201 ft | 57 ft | 121 gpm |
| Orange | 27,322 | 48 ft | 24 ft | 40 gpm |
| Nevada | 26,988 | 222 ft | 61 ft | 13 gpm |
| Kern | 25,482 | 368 ft | 107 ft | 31 gpm |
| Contra Costa | 25,298 | 42 ft | 18 ft | 19 gpm |
| San Luis Obispo | 24,678 | 245 ft | 97 ft | 51 gpm |
| Placer | 23,683 | 205 ft | 37 ft | 12 gpm |
| El Dorado | 20,696 | 250 ft | 44 ft | 14 gpm |
| Madera | 20,670 | 377 ft | 177 ft | 28 gpm |
| Butte | 20,446 | 159 ft | 54 ft | 21 gpm |
| Stanislaus | 18,770 | 186 ft | 52 ft | 75 gpm |
| Mendocino | 18,564 | 128 ft | 33 ft | 12 gpm |
| Merced | 18,241 | 203 ft | 40 ft | 102 gpm |
| San Mateo | 16,331 | 40 ft | 14 ft | 14 gpm |
| Tehama | 15,832 | 165 ft | 84 ft | 55 gpm |
| Yolo | 15,745 | 201 ft | 36 ft | 77 gpm |
| Shasta | 15,683 | 149 ft | 51 ft | 29 gpm |
| Santa Barbara | 15,465 | 229 ft | 82 ft | 54 gpm |
| Solano | 14,458 | 111 ft | 16 ft | 50 gpm |
| Monterey | 14,091 | 259 ft | 91 ft | 26 gpm |
| Ventura | 13,412 | 210 ft | 45 ft | 33 gpm |
| Napa | 12,148 | 295 ft | 47 ft | 35 gpm |
| Yuba | 10,693 | 169 ft | 41 ft | 16 gpm |
| Siskiyou | 10,650 | 137 ft | 44 ft | 23 gpm |
| Plumas | 10,197 | 149 ft | 31 ft | 18 gpm |
| Santa Cruz | 9,706 | 201 ft | 75 ft | 19 gpm |
| Kings | 9,185 | 270 ft | 93 ft | 101 gpm |
| Sutter | 8,979 | 109 ft | 17 ft | 76 gpm |
| Calaveras | 8,274 | 304 ft | 80 ft | 21 gpm |
| Amador | 7,959 | 266 ft | 68 ft | 17 gpm |
| Mariposa | 7,433 | 224 ft | 45 ft | 15 gpm |
| Tuolumne | 7,338 | 323 ft | 56 ft | 19 gpm |
| Lake | 7,083 | 118 ft | 47 ft | 29 gpm |
| Glenn | 7,056 | 157 ft | 78 ft | 53 gpm |
| Marin | 7,049 | 49 ft | 21 ft | 10 gpm |
| San Francisco | 6,902 | 28 ft | 12 ft | 10 gpm |
| Humboldt | 6,685 | 65 ft | 45 ft | 13 gpm |
| Lassen | 5,730 | 154 ft | 34 ft | 24 gpm |
| Colusa | 4,082 | 226 ft | 44 ft | 55 gpm |
| Trinity | 3,275 | 164 ft | 63 ft | 12 gpm |
| Modoc | 2,931 | 226 ft | 47 ft | 50 gpm |
| San Benito | 2,889 | 228 ft | 54 ft | 42 gpm |
| Inyo | 2,661 | 141 ft | 30 ft | 55 gpm |
| Del Norte | 2,387 | 44 ft | 19 ft | 19 gpm |
| Mono | 1,789 | 202 ft | 64 ft | 51 gpm |
| Imperial | 1,405 | 64 ft | 26 ft | 77 gpm |
| Sierra | 967 | 164 ft | 40 ft | 22 gpm |
| Alpine | 640 | 146 ft | 33 ft | 28 gpm |
Explore every well
The static map above is the whole state at a glance. Open the interactive DrillerDB well map to zoom to any California address, click individual wells, and read their depth, water level, and construction details.
Open the well map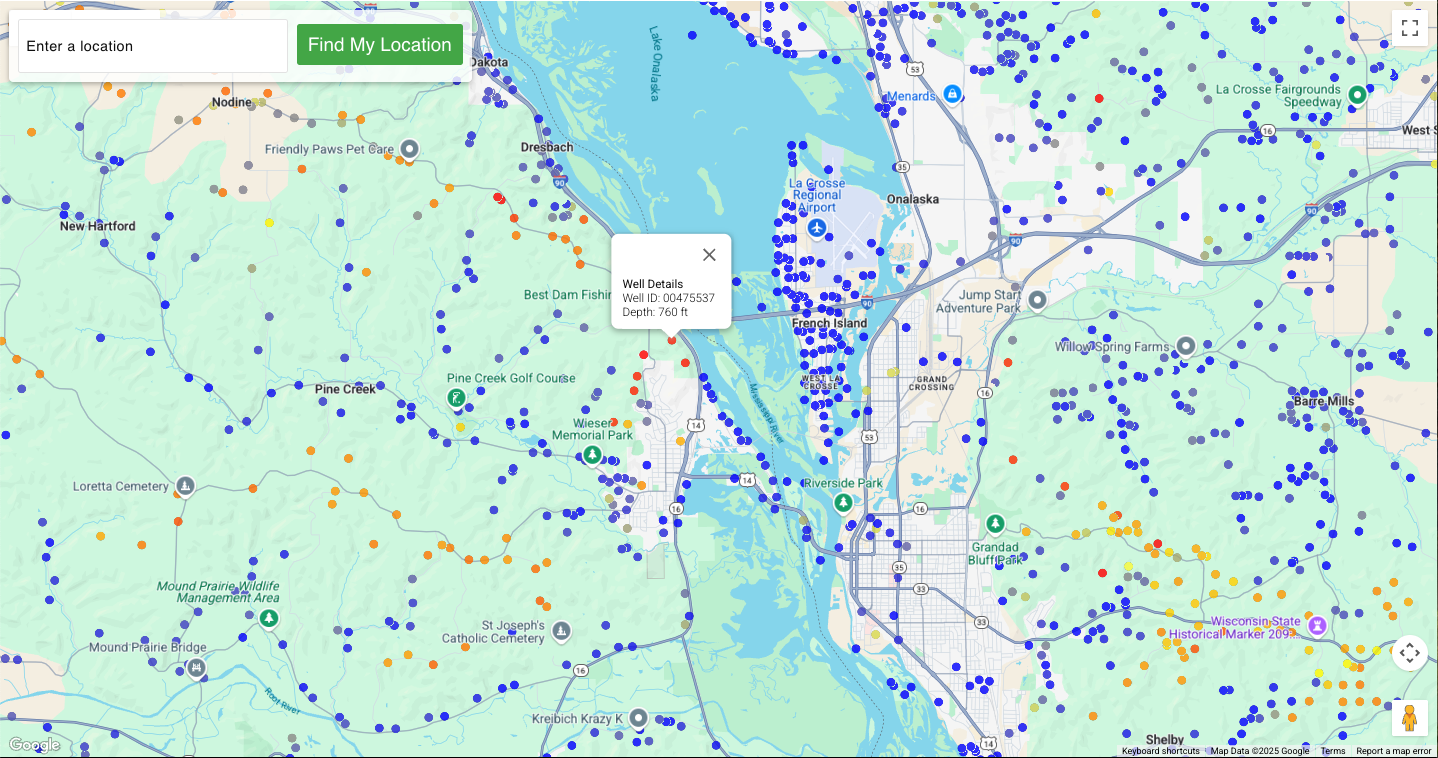
A century of California wells
DrillerDB's California records reach back to the 1930s. Wells drilled per decade:
California well questions
How deep are wells in California?
The median depth across California borehole records is 165 ft, based on 748,656 records with a reported depth. Half fall between 64 and 308 ft. Depth varies a lot by county - from about 28 ft in the shallowest counties to over 377 ft in the deepest. These records cover every borehole filed with the state - water wells alongside monitoring wells, soil borings and decommissioning reports - so this is a broader population than water wells alone.
What is the water table depth in California?
The median static water level (the depth to standing groundwater) across California records is about 53 ft. It is usually much shallower than the finished well depth, because wells are drilled past the water table to reach a dependable aquifer.
How many well records does California have?
DrillerDB holds 1,051,746 California well records - part of an 18-million-record national database built from state well-construction reports.
How do I look up a specific address or well in California?
Use the free water table depth lookup to see typical depth and water level at any address, or open the interactive well map to browse individual well records near a location.
Source: 1,051,746 California well-construction records in the DrillerDB database, current through June 2026. Medians are computed from reported values; individual wells vary. Always confirm site conditions with a licensed local driller.
Well data for other states
The same real-record breakdown - median recorded depth, static water level, yield, and county tables - for the other states in the DrillerDB database.
Researcher? Academic and institutional researchers can get free record-level access to these wells for non-commercial work through the DrillerDB Research Program.
About the Research ProgramPlanning a well?
Start with the free address lookup, then find a licensed California driller.
Drill wells for a living?
This is the same well data that powers quoting, scheduling, and state reporting for drilling companies across the country.
See DrillerDB for contractors